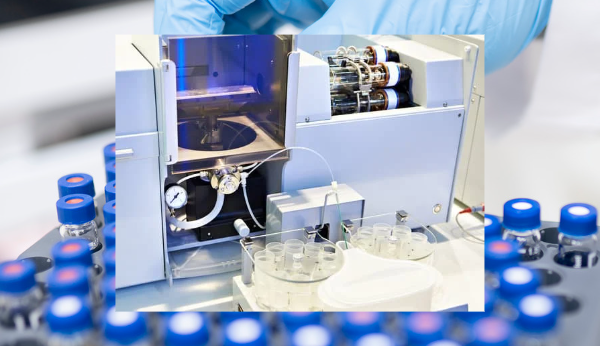
We detect early signs of machine failures and diseases that cannot captured by the human eyes,
and support measures and preventive actions to avoid serious accidents and diseases before they happen.
With this technology, we contribute to the eradication of serious machine failures and diseases.
Technology to detect slight changes in people and objects
We are a company that provides technology to free people around the world from all kinds of risks.
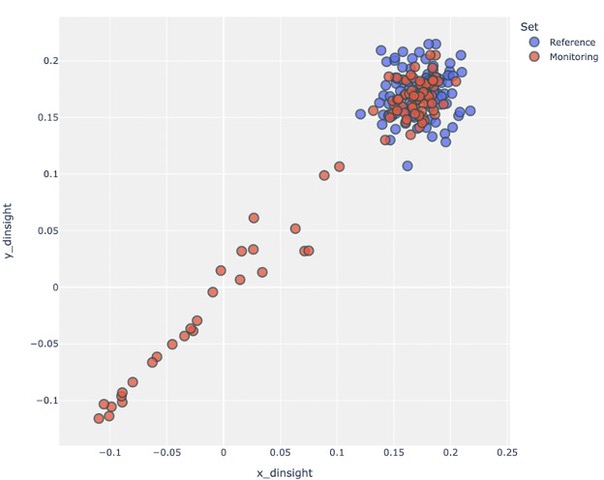
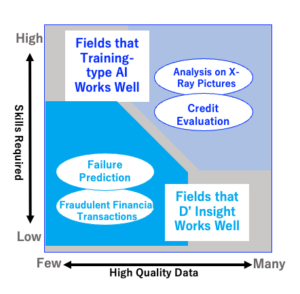 any kind of problems. But this is a great misunderstanding. Indeed, in fields where high-quality training data is abundantly available, training-type AI is an extremely powerful tool. On the other hand, “D’Insight”, a visualization-type AI, can quickly capture slight changes in the target without training, so high-quality training data is not necessary. In reality, the fields where high-quality training data can be obtained are limited in the world. In such an environment, “D’Insight”, which can quickly grasp the degree of modulation of the target, is extremely effective in preventing major risks such as failures, diseases, fraud, and even catastrophic breakdowns in advance.
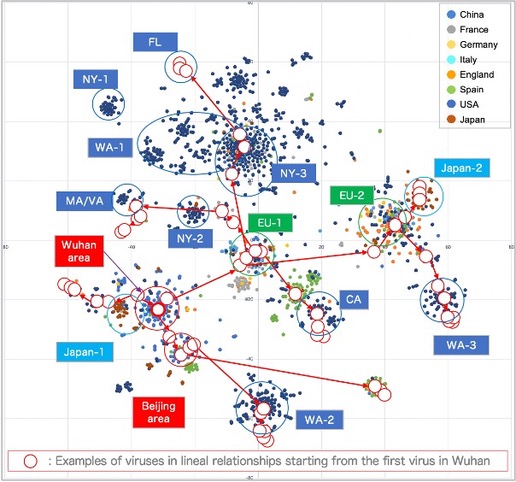
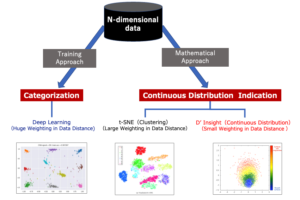 Training-type AI attempts to understand the distribution of multidimensional data through training; data for training is initially required. On the other hand, visualization-type AI reduces the dimensions of multidimensional data distribution using mathematical methods and displays it in the form of a two-dimensional (or three-dimensional) map that humans can understand; it does not require training data. The former is suitable for categorization, such as distinguishing between dogs and cats. On the other hand, the latter is suitable to illustrate degree of changes, such as the degree of degradation. We believe you will understand that visualization-type AI is suitable for the visualization of risk that we analyze.